Energy Metric Highlights
Energy Highlights FY 2023 vs FY 2022 - Utilities
**Reported metrics are for the Dallas Main Campus – All Facilities Tied into Substation, Patterson Hall & Mustang Central Plants**
(97% of total SMU power, 98% of natural gas, 99% of water)
Square Footage had a net decrease of 131,511 to a total of 4,410,926 square feet
(up 1% 35,548 sq.ft . from FY17 baseline)
- Three Cox Business School facilities taken offline for major remodel.
- Added Owens Art Expansion and Washburne Stadium.
Electrical Consumption decreased by 9% from 83.7 to 76.5 million kWh
(down 15% from FY17 including new construction)
- This year’s total billed kwh was artificially reduced by one month (roughly 8.5M kwh) due to a change in the providers invoicing terms from 30 days to 60 days. Only 11 months billed in FY23.
Electrical Costs decreased by 9% from $4.8 to $4.3 million
(down 33% from FY17 baseline)
- Electrical cost impacted (roughly $200k) by the decrease in invoiced kWh (see point above).
Natural Gas Consumption increased 6% from 289,615 to 305,544 MMBtu
(up 19% from FY17 baseline)
- Increase is due to an 8% higher demand for steam, and a new boiler plant installed at Meadows Museum, and continuing steam/condensate loop issues. New metering on the condensate loop continues to show a high volume of “make up” water indicating water losses in the steam system. The high volume of make up water causes the boiler plant to consume more gas.
Natural Gas Costs increased 4% from $1.2 to $1.25 million
(down 3% from FY17 baseline)
- Natural gas costs were up due to increase in steam demand and make up water.
Water Usage & Costs increased 30% from 198M to 251M million gallons
(up 6% from FY17 baseline)
- The significant increase in water is explained in the Water section of this report.
Total Energy Costs decreased 6% from $5.96 to $5.57 million
(down 28% from FY17 including new construction)
- Energy rates are largely fixed in both electricity and natural gas, reflecting SMU strategy for predictability, protection, and stability. The hedging strategy continues to deliver a benefit to SMU in the long term. Electricity is hedged through 2030, while natural gas is hedged through 2024.
SMU Annual Energy Metrics:
Energy Efficiency Metrics Summary| Metric | FY17 | FY18 | FY19 | FY20 | FY21 | FY22 | FY23 |
| EUI | 128.7 | 132.1 | 122 | 122.3 | 118.08 | 126.66 | 128.43 |
| ECI | $1.76 | $1.66 | $1.37 | $1.32 | $ 1.12 | $ 1.31 | $1.26 |
| KWH / GSF | 20.48 | 20.94 | 20.70 | 18.35 | 16.83 | 18.43 | 17.34 |
| KW /Ton | 0.67 | 0.63 | 0.63 | 0.60 | 0.52 |
- EUI The Energy Utilization Index increased in FY23 due to increased Natural gas
consumption, negatively impacting this metric.
- ECI The Energy Cost Index decreased, staying well below target. This includes cost
of power and natural gas.
- KWH/GSF Electrical energy consumption per gross square foot of campus building
space dipped in FY23, in part due to change in invoicing terms mentioned above.
- KW/Ton The Central Plant efficiency was excellent, improving to 0.52 and remains
at levels well below our goal of 0.66 for a rolling 12 month average.
Water Metrics Summary
| Metric | FY17 | FY18 | FY19 | FY20 | FY21 | FY22 | FY23 |
| Gallons/Yr | 236M | 218M | 224M | 237M | 217M | 193M | 251M |
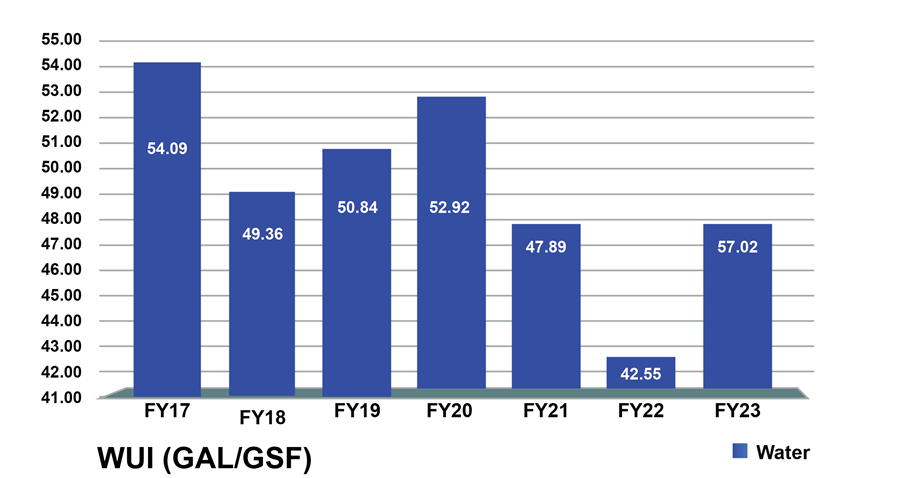
| WUI (Gal/GSF) | 54.09 | 49.36 | 50.84 | 52.92 | 47.89 | 42.55 | 57.02 |
- Gallons measures total domestic water consumed for the year. Domestic water is used in
building facilities, central plants, and irrigation.
- In FY23 there was a 30% increase in domestic water consumption compared to FY22. Further breakout of this utility is shown in the pages that follow.
- The WUI (Water Utilization Index metric), which also rose significantly in FY23, is a metric of water consumed in building facilities (does not include irrigation water, nor water used in the central plants), and measures gallons per square foot of building space. See following page for more detail.
- Understanding/Reversing this water use metric is an Energy Program priority and requires
coordination with other SMU Facilities departments.
- Additionally, 5.6M gallons of gray water was reused on campus (e.g. Moody Coliseum &
Junkins , Embrey, RC Commons toilets, and irrigation)
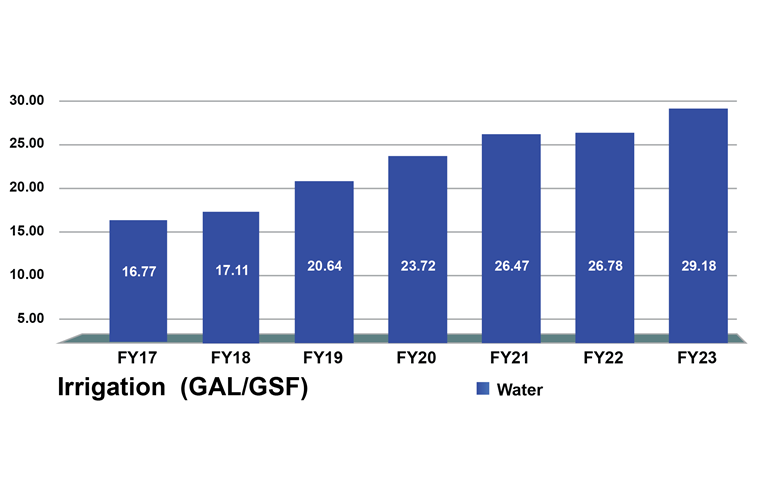
Irrigation Metrics Summary (sub-portion of water metrics)
| Metric | FY17 | FY18 | FY19 | FY20 | FY21 | FY22 | FY23 |
| Gallons/Yr | 31M | 32M | 38M | 44M | 49M | 50M | 54M |
| WUI (Gal/GSF) | 16.77 | 17.11 | 20.64 | 23.72 | 26.47 | 26.78 | 29.18 |
- Gallons in this table show total domestic water usage in
campus irrigation systems.
- Irrigation volumes and metrics in FY23 increased 8% compared
to FY22.
- The main campus system has 1,333 irrigation zones, and over
11,000 rotors and sprayers, plus miles of drip irrigation.
- The system is managed by smart controllers.
- WUI measures total domestic water consumed compared to total square feet of building space, and includes irrigation.
- This metric is significantly influenced by weather and rainfall.
-
Gallons in this table show total domestic water usage in campus irrigation systems.
-
Irrigation volumes and metrics in FY23 increased 8% compared to FY22.
-
The main campus system has 1,333 irrigation zones, and over 11,000 rotors and sprayers, plus miles of drip irrigation.
-
The system is managed by smart controllers.
Summary for FY23
- Total SMU utility spend was up slightly by $297k (electricity & natural gas & water combined)
- Received $41k for SMU’s participation in the ERCOT ERS30 program and avoided an estimated $110k in taxes on power.
- Continued improvement of the cooling plant efficiency metric to 0.52 KW/ton , well ahead of the national average.
- Received $189k Evaporation and Irrigation Credit from UP Water
- Hosted DFW Association of Physical Plant Professionals Annual Meeting at SMU to encourage interchange among peers
- Conducted four SMU Student Tours of the Central Plant, as well as two Siemens Executive tours