Information Visualization Tools
Is a table worth a thousand words? Visualization tools can help you make information clearer to students, either by providing you with clearer visuals or, better yet, assigning them to use visuals to make connections.
Introduction to Information Visualization Tools (what are they? how can teachers use them effectively? help from Carnegie Mellon)
46 Tools to Make Infographics in the Classroom (help your students deepen their understanding by showing connections, mapping, creating timelines, etc).
A Periodic Table of Visualization Methods (examples and comparisons to help choose the right tool for the job, laid out like the Periodic Table, from Visua-lLiteracy.org)
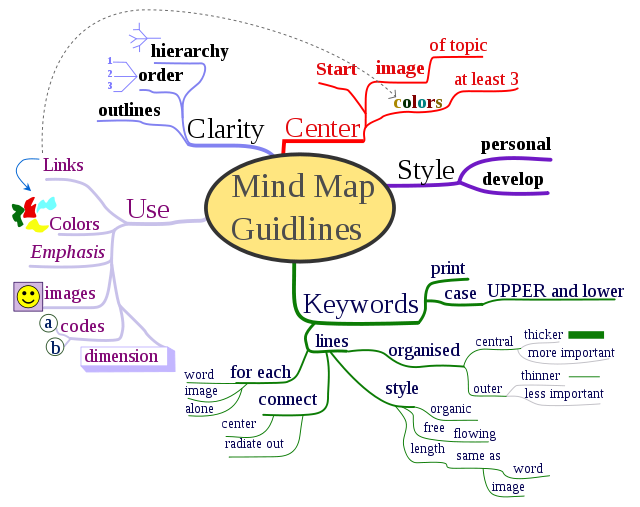
Best Tools and Practices for Concept Mapping (great resource from NspireD2, the teaching with technology blog from Notre Dame)
Classroom Assessment Tools: Concept Maps (video from the Center for Instructional Innovation, Western Washington University)
A Quick Look at Instagrok (web-based tool that creates a web-like visualization based on semantic relationships between terms, and also serves as a search engine) (remember Stranger in a Strange Land?)