Temperature Maps
The SMU temperature-at-depth maps start from the actual temperature measured in the Earth at as many sites as possible. In addition, the thermal conductance of the rocks (changing as the rock minerals change with deeper depths), the area heat flow, and the rock density (sedimentary rocks are less dense than basement rocks) are used to calculate the deeper temperatures. SMU Geothermal Lab calculates temperatures at specific depth intervals using these variables to produce the temperature maps at different depth slices for the United States.
Most of the measured temperatures used in the calculations are from sedimentary rocks which overlie the harder basement rock. The oil and gas industry has drilled into sedimentary rock as deep as 26,000 (ft) or 8 km in West Texas, yet more typical oil and gas drilling is 4,000 to 10,000 ft (1.2 to 3 km) depending on the depth to the resource. In areas with geothermal power production, drilling is usually in the 1 to 3 km depth range for western United States.
Temperature-at-depth maps are available for the following depths:
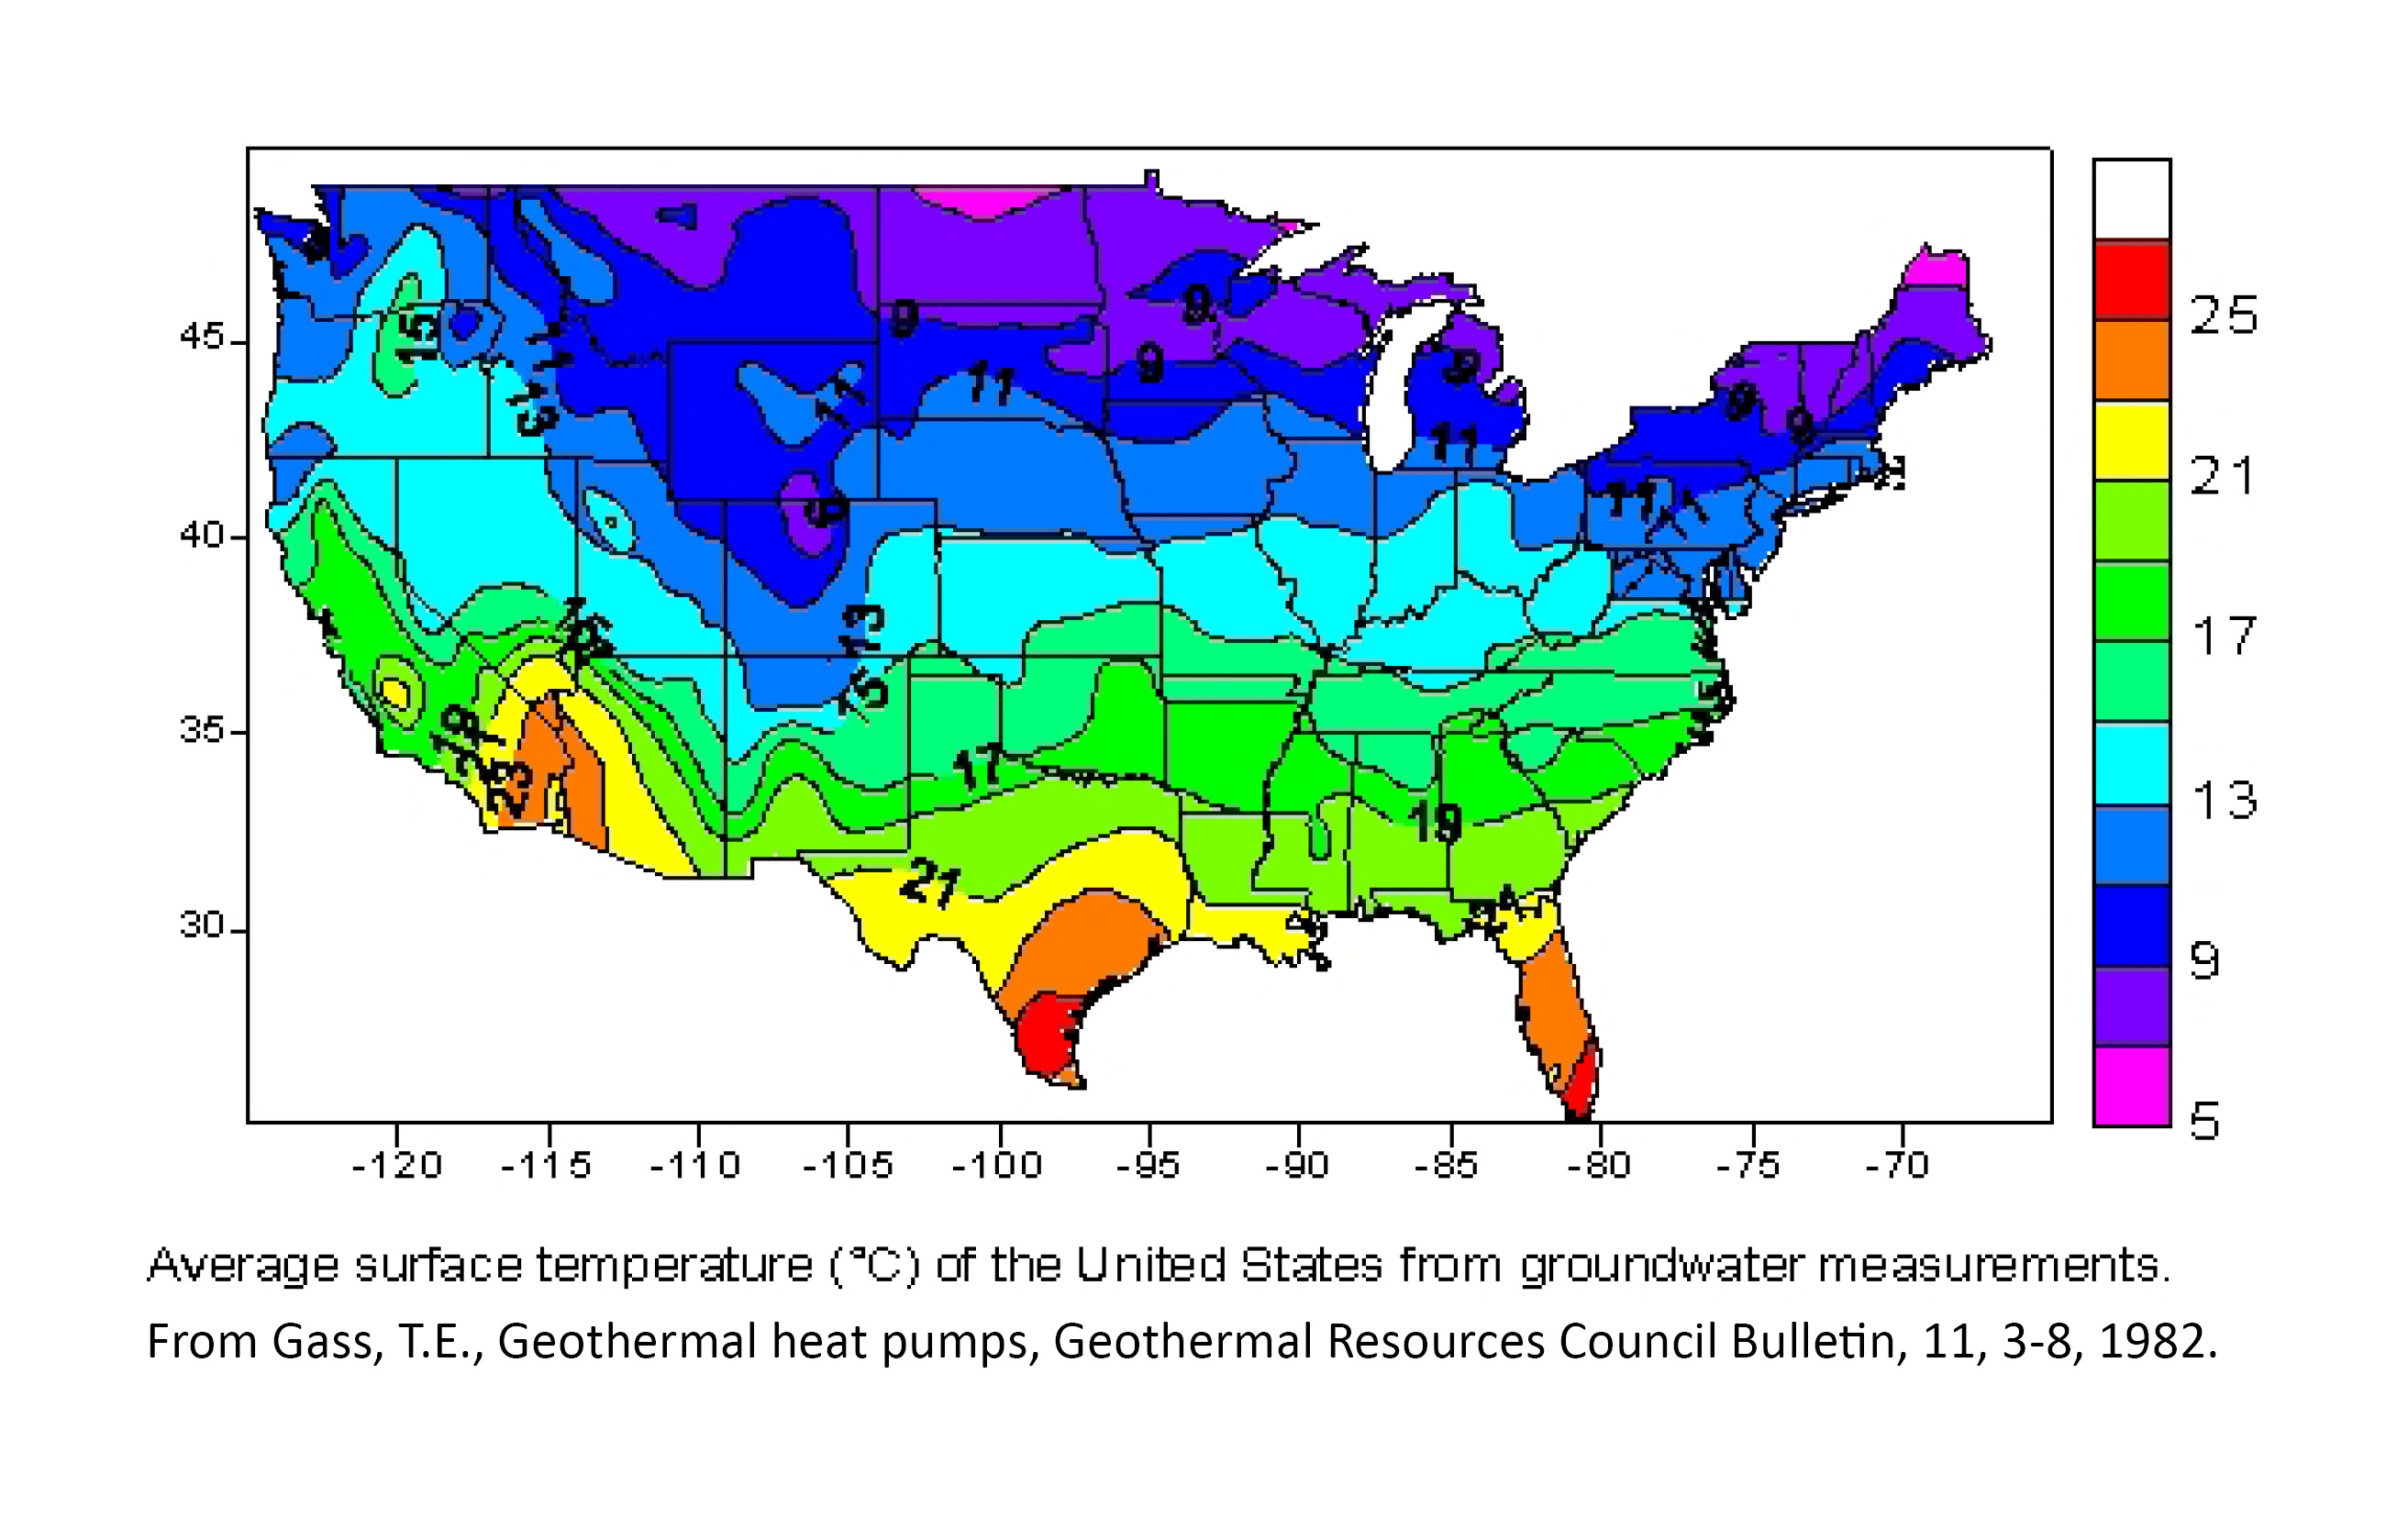
• near ground surface temperature map
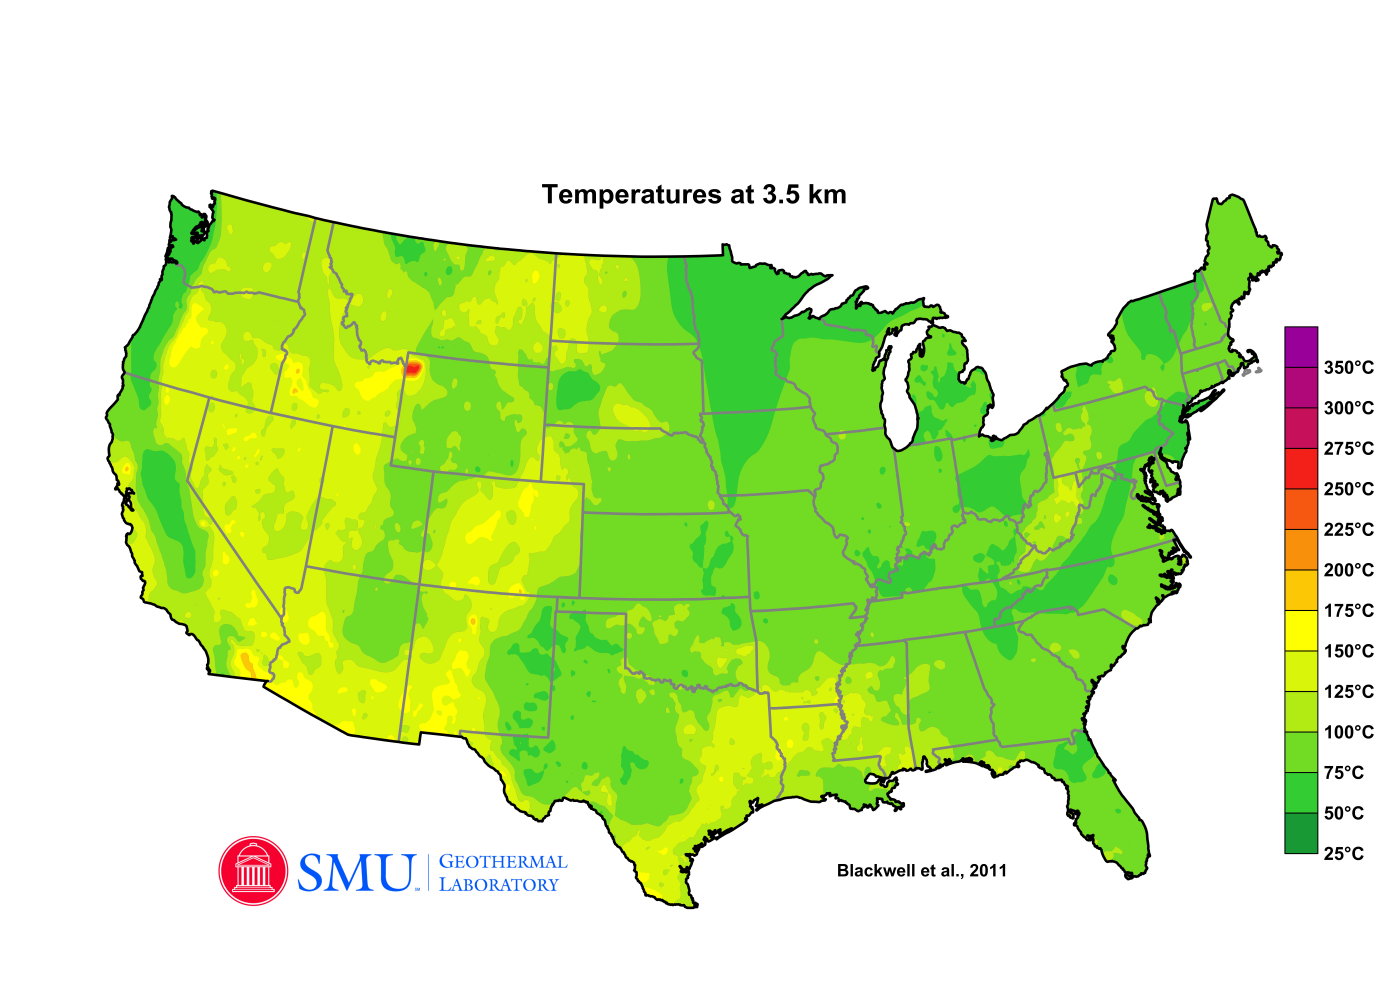
Digitized from Gass, T.E., Geothermal heat pumps, Geothermal Resources Council Bulletin, 11, 3-8, 1982.• 3.5 km temperature-at-depth map
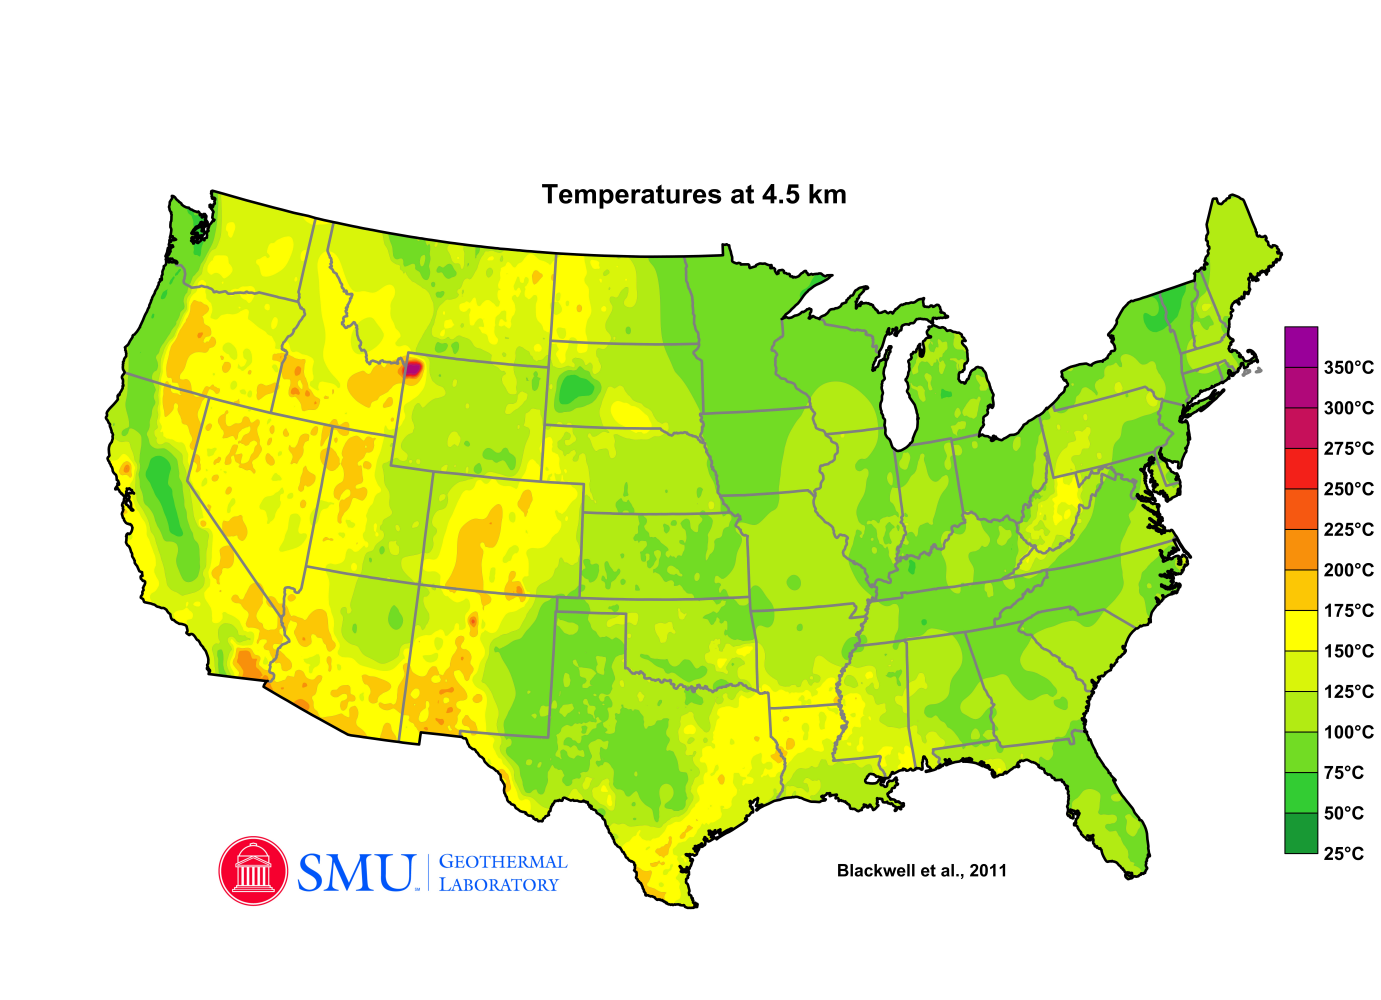
• 4.5 km temperature-at-depth map
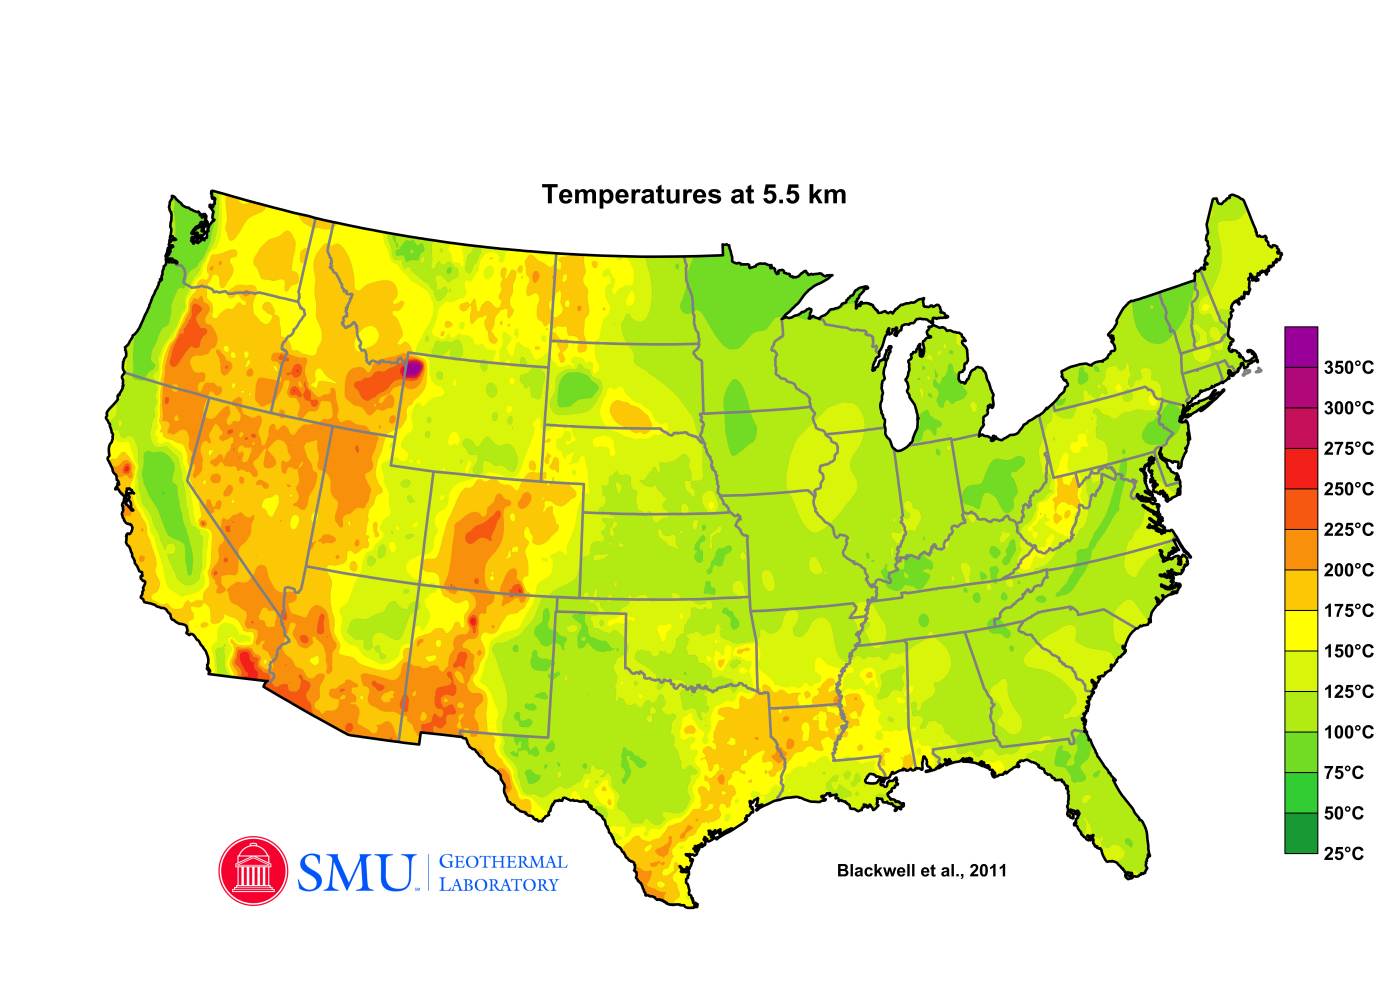
• 5.5 km temperature-at-depth map
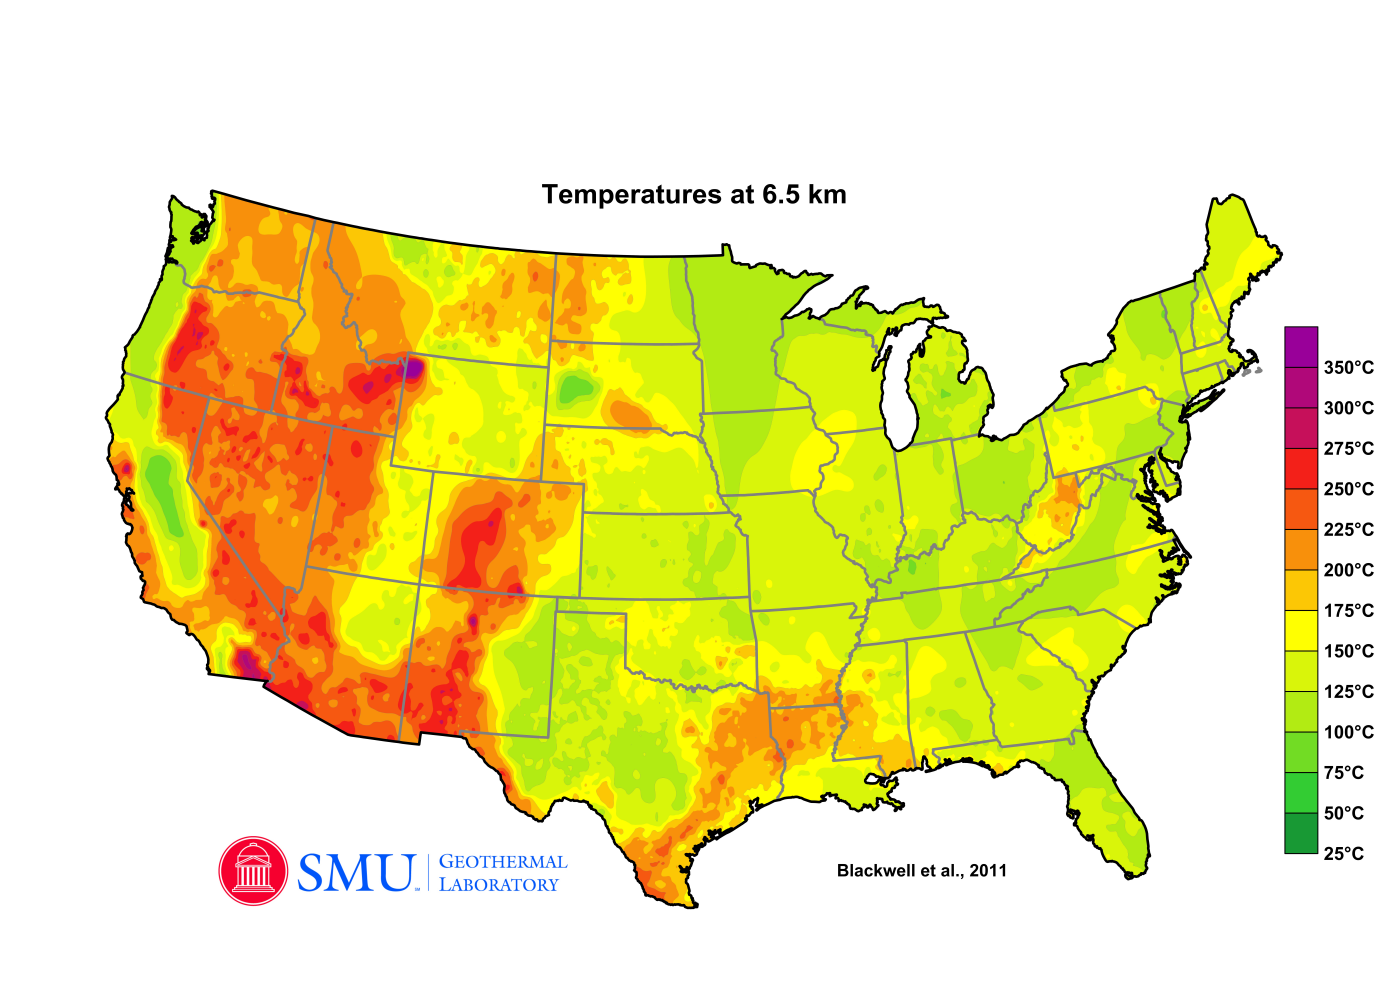
• 6.5 km temperature-at-depth map
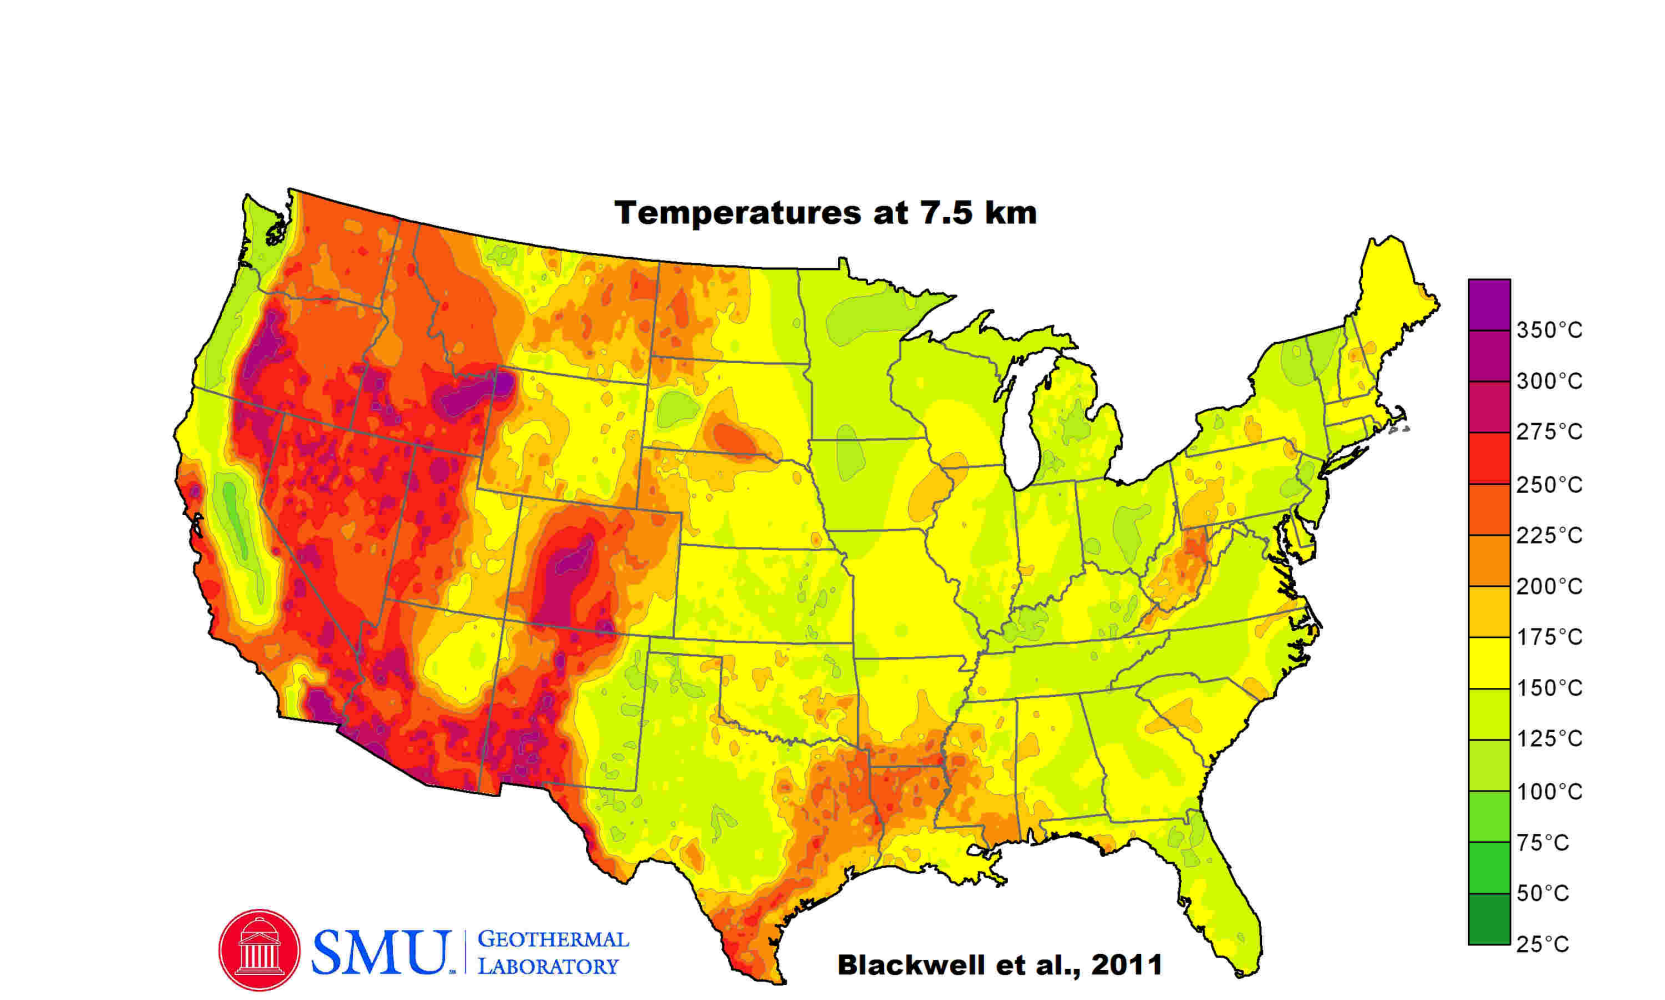
• 7.5 km temperature-at-depth map
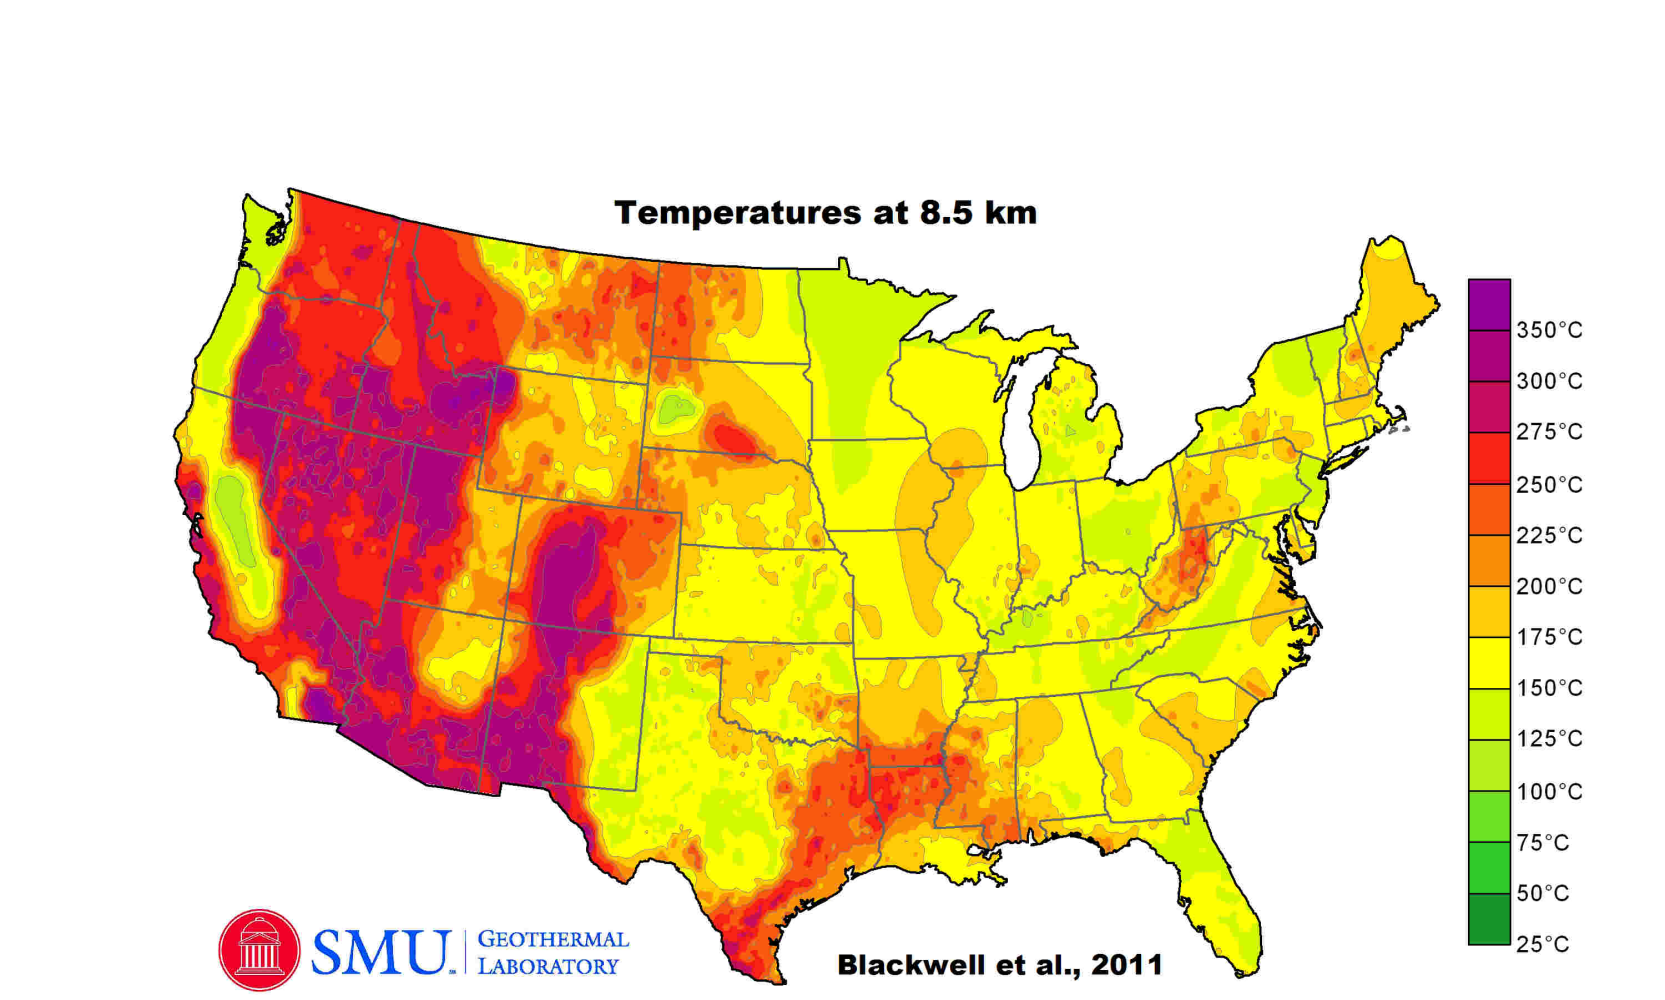
The citation for these maps is: Blackwell, D., Richards, M., Frone, Z., Ruzo, A., Dingwall, R., & Williams, M. (2011). Temperature-At-Depth Maps For the Conterminous US and Geothermal Resource Estimates. GRC Transactions, 35(GRC1029452).
Higher resolution versions of the 3.5 to 6.5 km temperature-at-depth maps are available for purchase from geothermal@smu.edu.
For information on temperatures at even greater depths, visit EarthScope.
For global heat flow data, visit the International Heat Flow Commission.