Data and Maps
The SMU Geothermal Lab is regarded as a center of excellence in both collecting geothermal data and using these data to produce maps. We have been active in field research, laboratory analysis of samples and data mapping since 1968.
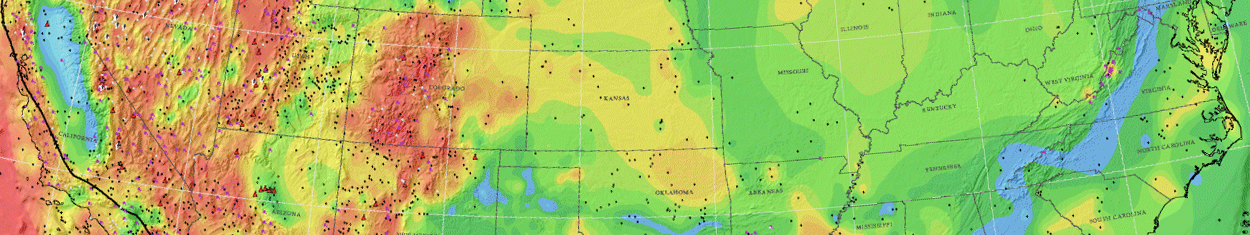
Our research begins in the field where we log the temperature of a site, typically a well. Field notes are made at each location and include coordinates of the location, surrounding topography and land cover, information on the well, the lithologies encountered during drilling, and the height of the water table. Back in the lab, a temperature-depth curve (TD curve) is generated from the temperature and depth measurements made in the field, and a geothermal gradient is calculated. Rock samples are analyzed for their thermal conductivity. Once we have values for geothermal gradient and thermal conductivity we calculate the heat flow for the site. These heat flow values for many thousands of sites are then combined to produce a geothermal map such as the Geothermal Map of North America. These data are also used to produce temperature-at-depth maps.
The data we have collected has been digitized, updated and compiled within the National Geothermal Data System (NGDS). Field notes and TD curves are linked to many of the thousands of heat flow sites contributed by SMU, along with information on thermal conductivity and geothermal gradient. The information that once resided in 3-ring binders on shelves in our lab is now available to researchers worldwide.